|
 |
 |
 |
| Start with the smallest balloon and work your way up to the largest balloon. |
 Inflate one balloon until it feels tight, but not stretched.
(This seems so subjective…but your goal is that the balloon be inflated as big as
possible while still being able to be covered with a second inflated balloon.) Inflate one balloon until it feels tight, but not stretched.
(This seems so subjective…but your goal is that the balloon be inflated as big as
possible while still being able to be covered with a second inflated balloon.)
 Tie a knot in the "neck" of the balloon in Step 1.
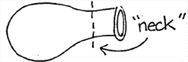
 Clip the "neck" of a second balloon as shown in the illustration below.

 One Student should stretch the clipped balloon (Step 2) while the partner stuffs the
inflated balloon (Step 1) inside it.
One Student should stretch the clipped balloon (Step 2) while the partner stuffs the
inflated balloon (Step 1) inside it.

Once this is done (the WORST is over), tie off balloon #2. Now clip a third balloon which will be used to cover the combined inflated balloon #2 which has balloon #1 inside.
 Continue covering until all the balloons have been used.Your result will be a "nested" set of balloons.
 |
HINT: An oblong balloon can be "rounded" by
positioning the open end of the clipped balloon in different spot each time. Clip the
"ring" off <image> the remaining band and use it to decorate and shape the
balloon ball. |
Number of balloons used to make your
bouncing balloon:
|
|

|
Drop Height
distance that the bottom of
the balloon is above the ground.
X |
Bounce Height
distance that the bottom of
the balloon is above the ground.
Y |
Y/X |
|
cm |
cm |
|
|
cm |
cm |
|
|
cm |
cm |
|
Average of
this column |
|
|
|

|
Drop Height
X |
Bounce Height
Y |
Y/X |
|
cm |
cm |
|
|
cm |
cm |
|
|
cm |
cm |
|
Average of this column |
|
 ….find the average
of your two averages! ….find the average
of your two averages!
We will call this number the constant of your function.

Under the best of scientific testing conditions, the
function of your Balloon Ball would have been a Linear Function,
meaning that it’s graph would be on a line.
Let’s see how close you came to optimum conditions by
graphing your X’s and Y’s from both trials….
A grid is provided below. Be sure to place tight circles around each data point and to label your axes. Draw in a line of best fit. Remember that a line of best fit approimates the data but does not have to pass through any data points. Hopefully you have have a least two grid points with which you calculate the equation of the line.
 …..how did you do?
Are your results an approximation of a line? What are some casual factors? …..how did you do?
Are your results an approximation of a line? What are some casual factors?

 Once again, what was the constant of your
function?
Once again, what was the constant of your
function?
 What was the constant of your partner's function? What was the constant of your partner's function?
 How would you account for the difference in your constant and
your partner's constant? (Give at least two possible causes) How would you account for the difference in your constant and
your partner's constant? (Give at least two possible causes)
 How could you use your constant to make predictions concerning your
bouncing balloon? How could you use your constant to make predictions concerning your
bouncing balloon?
 Let’s try! If the drop height were , what would
you predict the bounce height to be? Let’s try! If the drop height were , what would
you predict the bounce height to be?

 How did your experimental results compare with your predicted results?
Explain any similarities or differences. How did your experimental results compare with your predicted results?
Explain any similarities or differences.
|

