Discuss the interpretation of each graph. Answer questions using complete sentences.
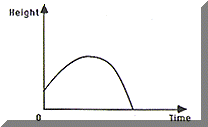
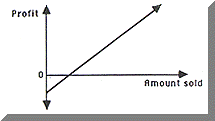
| Cannonball shot from a cannon | Lemonade stand | |
 |
 |
|
| 1) When time is zero, why isn't height zero also? 2) In real-life situations, why are we often restricted to positive values? | 1) Why does the graph show value below zero? 2) What is the meaning of the point where the graph crosses the horizontal axis? |
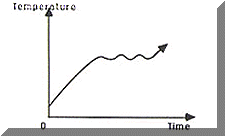
| Roast in the Oven |
Flag |
|
 |
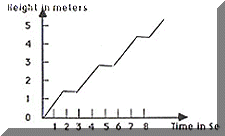 |
|
| 1) Why is the roast's initial temperature close to 0 F 2) Why does the graph have a wavy appearance? | 1) What was happening to the flag? 2) What was the height of the flagpole? 3) Explain the shape of the curve. |
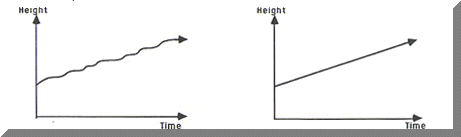
Tree Growth
Contrast the two graphs below. Which would be the graph for the growth of a tree over several years?
Race
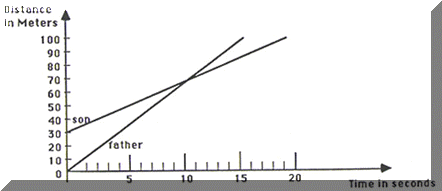
| A boy challenges his father to a 100m race. The father allowed his son to start 30m ahead of him. Their highly simplified graphs are shown in the figure below | |
|
|
| 1) Who won the race? 2) How far from the start did the father overtake the son? 3) How many seconds from the start was this? | |
Sledding
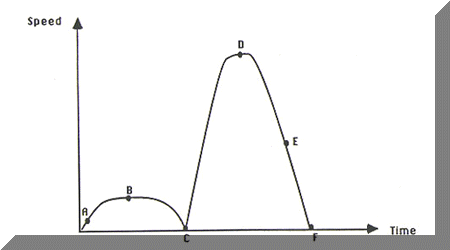
| The event "climbing a hill and sledding down" is depicted below. Describe the sledder's journey at points A, B, C, D, E, and F. |
|