Experiment 3
Page 3
|
 |
|
| Equipment | |
 rulers, tape measures, or yard sticks, 1 per group rulers, tape measures, or yard sticks, 1 per group |
|
 objects tall enough to be measured and to make a shadow objects tall enough to be measured and to make a shadow |
|
 graph paper, 1 sheet per student graph paper, 1 sheet per student |
|
| Procedure | |
| This experiment requires daylight. Best results are
obtained if you do NOT conduct this experiment around noon. Moreover, if you must use thin objects they should be at least 10 inches tall. All measurements must be completed during the same class period. Be flexible in your plans if it is not a sunny day. |
|
| If there at least 12 groups, have half the groups measure
in centimeters, the other half in inches. Keep the data separate; at the end of the
experiment you may want to compare the equations and graphs. |
|
| Graphing | |
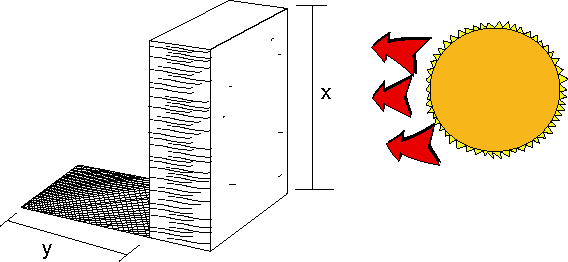
| When all of your measurements have been completed, each group is to then graph their data on graph paper. Remember that the object's height is the independent variable and the length of its shadow is the dependent variable. aEach member of the group is to complete their own graph. Scaling your graph's x- and y-axes should be maximized so that each person's graph completely fill the page. Label each axis and its respective scale. The x- and y-axes do NOT have to have the same scale. Draw in a line of best fit and calculate its equation. |
 page 2
Copyright 1997-1999: html adaptation
Career Connection to Teaching with Technology