
These web-based activities were developed, during summer sessions from 1997 through 1999, by students at Mainland High School, located in Daytona Beach, FL. As part of Mainland's CCTT grant, the students were given permission by the book's publisher to convert the ancillary materials of the County's adopted Algebra 1 Textbook into html format.
Study Guide
Box-and-Whisker Plots
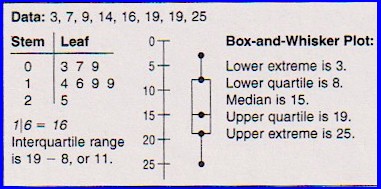
A box-and-whisker plot displays the extremes, the quartiles, and the median for a set of data. It may be drawn horizontally or vertically. Study the box below. Note the dots marking the extremes, the quartiles, and the median.
|
|
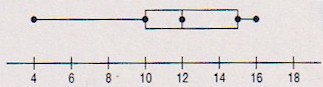
Answer questions #1-4 using the indicated box-and-whisker plot.
|
What are the upper and lower extremes?
4; 16 |
What is the median?
12 |
|
What are the upper and lower quartiles?
15; 10 |
|
What is the interquartile range?
5 |
Answer questions #5-8 using the indicated box-and-whisker plot.
|
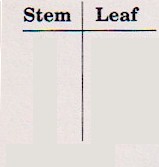
Graph the data in a stem-and-leaf plot.
|
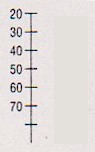
Transfer the data to a vertical box-and-whisker plot.
|
|
What are the extremes?
19; 73 |
|
What is the interquartile range?
20 |
|
Why are the whiskers unequal?
The difference between the LQ and the least value is greater than the difference between the greatest value and the UQ. |
|
How is an outlier determined? Are there any outlier values?
Multiply 1.5 times the interquartile range, 20. Then add this product to the UQ, 50, and subtract it from the LQ, 30. This results in the values 0 and 80 - therefore we have no outliers in this data. |
Copyright 1997-1999: html adaptation
Career Connection to Teaching with Technology