These web-based activities were developed, during summer sessions from 1997 through 1999, by students at Mainland High School, located in Daytona Beach, FL. As part of Mainland's CCTT grant, the students were given permission by the book's publisher to convert the ancillary materials of the County's adopted Algebra 1 Textbook (Glencoe Algebra 1 - ISBN: 9780028253282) into html format.
Modeling Mathematics
Circle Graphs
This activity is found on page 216 of your textbook. You will need a compass and a protractor.

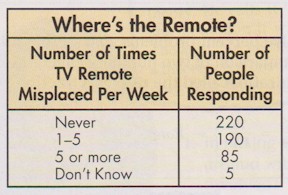
You can use a circle graph to compare parts of a whole. Follow the steps to display the data below in a circle graph.
Your Turn

|
- Find the total number of people surveyed.
- Find the ratio that compares the number of people who responded in each category to the total number of people who responded to the survey.
- Since there are 360° in a circle, multiply each ratio by 360 to find the number of degrees for each section of your graph. Round to the nearest degree.
- Use a compass to draw a circle and a radius as shown at the left. Larger circles are easier to apportion.
- Use a protractor to draw angles. Start with the least number of degrees. Repeat for the remaining sections. Label each section and give the graph a title.
- What is the sum of the percents in your graph?
|
Copyright 1997-1999: html adaptation
Career Connection to Teaching with Technology