
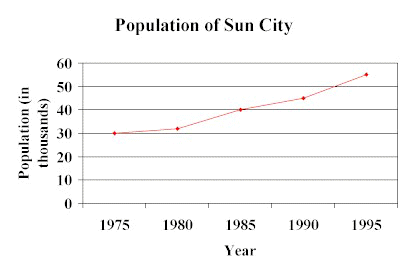
The line graph shows the population of Sun City over a 20-year period.
|
 |
 |
Using the graph above, how much did the population of Sun City increase from 1980 to 1990? | ||||
| Solution: From the graph determine the populations for 1980 and 1990 and then subtract their values to find your answer. | |||||
Answer: The population of Sun City increased by 13,000 people. |
|||||
TRY THIS ONE |
Using the graph above, during which 5-year period was the increase in the population the greatest? | ||||
 PRACTICE PRACTICEContinue using the graph above for Exercises 1-4 |
|

Copyright 1997-1999: html adaptation
Career Connection to Teaching with Technology