 |
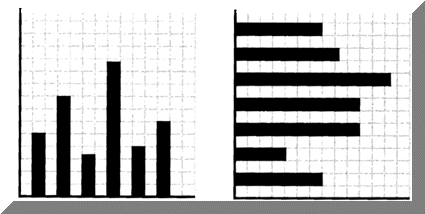
One way to present data is in bar graph. Bar graphs can be created with vertical bars or with horizontal bars.
 |
A survey of 150,000 residents of Cooke County showed the following income levels.
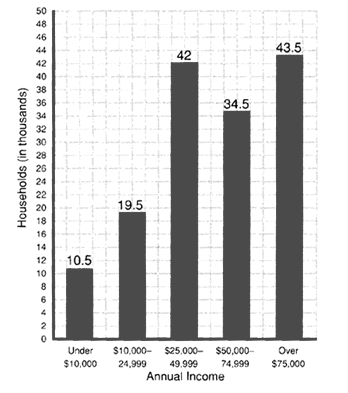 |
A. Use the information in the graph on page 39 to complete each item.
1. The largest number of household belongs to what income level?
2. What percent of the household surveyed reported annual income of over $50,000? (Remember: to find percent you divide the number of household that fit this criteria by the total number of households surveyed and multiple your answer by 100)
3. The table below shows the percent of household that report annual income for each category on a national level. Complete the table with the appropriate percentage for Cook County.
| . | National | Cooke County |
| Under $10,000 | 15% | . |
| $10,000-24,999 | 27% | . |
| $25,000-49,999 | 33% | . |
| $50,000-74,999 | 23% | . |
| Over $75,000 | 10% | . |
4. How would you describe the income levels in Cooke County as compared to the national income level?
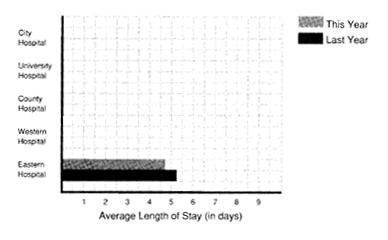
B. Construct a horizontal bar graph using the following information. Plot the bar for last year and this year adjacent to one another. Use the data plotted for Eastern Hospital as a guideline.
A researcher investigated five hospitals to find the average length of stay last and this year. Here are the figures:
| Last Year | This Year | |
| Eastern Hospital | 5.3 | 4.8 |
| Western Hospital | 8.1 | 7.3 |
| County Hospital | 5.0 | 4.2 |
| University Hospital | 8.2 | 6.7 |
| City Hospital | 5.9 | 5.1 |
 |
C. Use the information in the bar graph you completed to answer each item.
1. What general statement can you make about the length of stay in the hospitals investigated?
2. Can you tell at the bar which hospital had the greatest decrease in length of stay?
3. Calculate the percent decrease in length of stay for each hospital. Include these figures with a minus sign to the right of the appropriate bars. Round to the nearest tenth of a percent.
4. Which hospital had the smallest percent change in length of stay?
D. On Your Own
1. Work in a group with 2 or 3 other people. Each person should:
a) toss a coin 30 times and read the number of heads and tails on a frequency table
b) complete the frequency table on a with every other group member's data
c) make a double bar graph (either horizontal or vertical) that show's each group member's results
2. What was the median numbers of heads? tails? for your group.
3. What is main number of heads? tails? for your group
4. Measure of central tendency in you experiment, mean or median, is closer to the theoretical probability that you will get heads 50% of the time when you toss a coin?
790609081975