| Line Graphs | |
| Have you ever heard the saying "a picture is worth a thousand words"? What does the saying mean? Is the saying true for you? | |
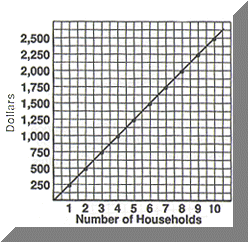
| The town of Rockville is considering a combination solid-waste disposal/recycling program. Town officials estimate that a program offering curbside collection would cost $250 per hosehold per year. This figure is based on a 43% recycling rate. The higher recycling rate, the lower the cost. You already know that ratios and proportion can be used to compare numbers. These number can represent events or items. You can relate one event to another and represent it in different ways. A graph is one way to represent a set of numbers or event visually. |
|
To show the cost of the disposal/recycling program for different number of hoseholds, we can use this line graph. |
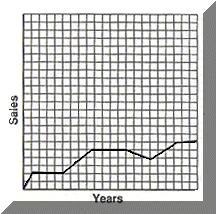
Some line graphs show fluctuation and movements. Line graph might represent a company whose sale have gone up and down over a time period. |
|
 |
 |
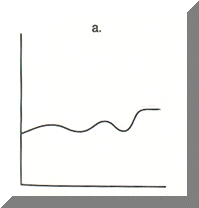
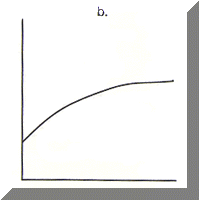
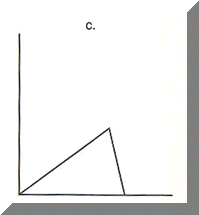
A. Write a letter of the graph that matches each description. |
||
 |
 |
 |
|
| B. Sketch a graph to match each description. | ||
| 1. Kelly is doing a 40-minute aerobic workout. She startes with a 10-minute warm-up to increase her heart rate gradually. She maintains this heart rate for 20 minutes and then slows down to lower her heart gradually. Sketch a graph that shows Kelly's heart rate during the 40-minute workout. | 3. A hurdler practices with 4 hurdles, all of which are same height and space equally along a straight track. Graph this run. | |
 |
|
|
2. A pole-vaulter runs along the ground a short distance, vaults up about 18 feet over the crossbar, and then lands on a mat. Graph this movement. |
4. A women long jumper runs for a short distance, leaps off the ground, and lands in the sand 22 feet from where she left the ground. Graph this movement. |
|
|
|
|
| C. On Your Own | ||
| Sketch a graph about a topic of your
choice. Explain your graph.
|
||