Study Guide: Section 7-8
Graphing Inequalities in Two Variables
Practice Problems
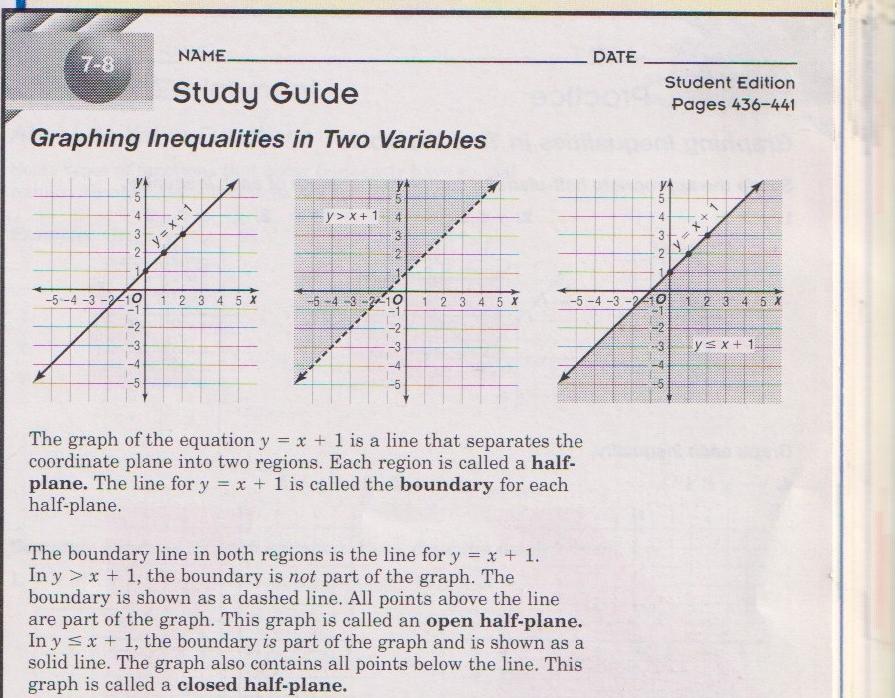
Directions: Graph each inequality on a coordinate plane. Determine whether the boundary line is solid or dashed, and shade the appropriate half-plane.
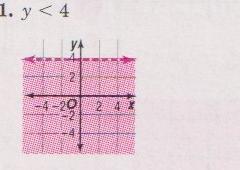
Boundary line: y = 4 (dashed horizontal line).
Region: Open half-plane shaded below the line.
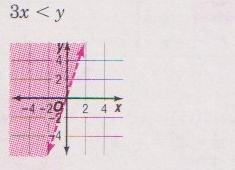
Boundary line: y = 3x (dashed line through origin, slope 3).
Region: Open half-plane shaded above the line.
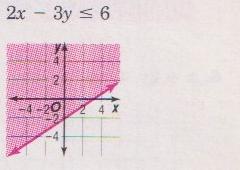
Boundary line: 2x − 3y = 6 (solid line, intercepts at (3, 0) and (0, −2)).
Region: Closed half-plane shaded above and on the line.
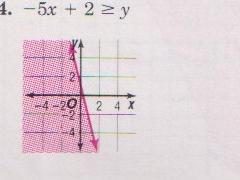
Boundary line: y = −5x + 2 (solid line, y-intercept (0, 2), slope −5).
Region: Closed half-plane shaded below and on the line.
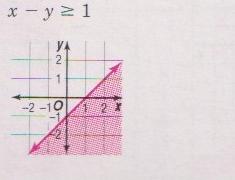
Boundary line: x − y = 1 (solid line, intercepts at (1, 0) and (0, −1)).
Region: Closed half-plane shaded below and on the line.
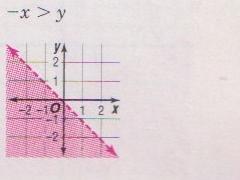
Boundary line: y = −x (dashed line through origin, slope −1).
Region: Open half-plane shaded below the line.