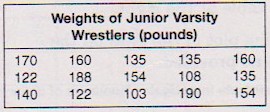
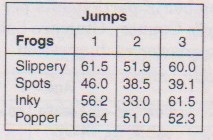
Study Guide The table to the right shows the final results of the Great Frog Competition in Dickerson County. The frog jumps were measured in inches. Numerical information displayed on a number line is called a line plot. This line plot shows the data for the frog jumping contest. 1. Make a table comparing the highest mountains in the United States: 2. Make a line plot representing the weights of the wrestlers. Insert labels and x's on the number line. 3. How many wrestlers are in weight classes over 140 lbs? 4. What is the largest weight class?
Integration Statistics Line Plots

Mt. Elbert, 14,433 feet
Mt. Rainier, 14,410 feet
Humphrey Peak, 12,633 feet
Kings Peak, 13,528 feet.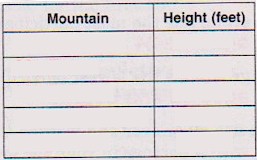
Use the table at the right for Exercises #2-4.