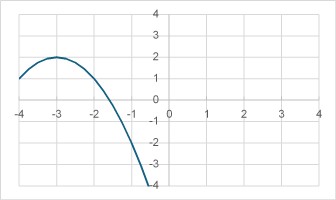
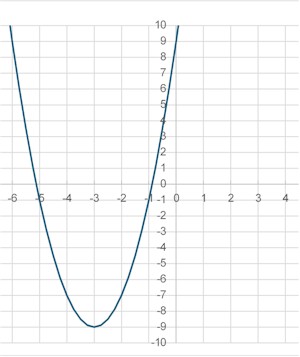
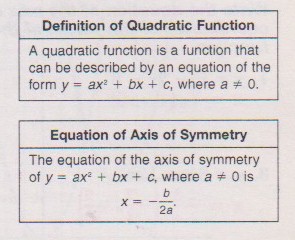
Study Guide: An equation such as y = x2 −4x + 1 describes a type of function known as a quadratic function. Graphs of quadratic functions have certain common characteristics. They have a general shape called a parabola. They have a minimum or maximum point. In general a parabola will open up and have a minimum point when the coefficients of y and x2 have the same sign.
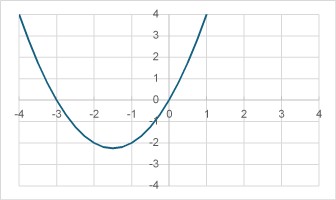
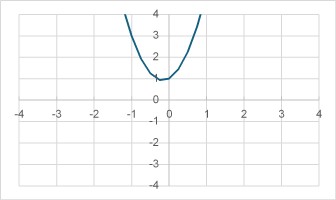
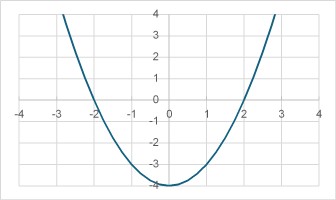
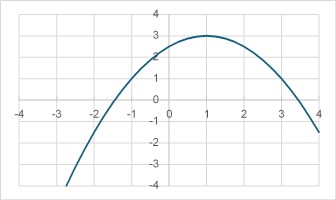
It will open downwards and have a maximum when the coefficients of y and x2 have an opposite sign. The vertical line containing the minimum or maximum point is called the axis of symmetry. The minimum or maximum point is called the vertex of the parabola. Directions: Write the equation of the axis of symmetry and find the coordinates of the vertex of each equation. Then graph the equation on the axes provided. You can view the correct graph by clicking on the point listed as passes through. 1. y = x2 + 3x x = −3/2 (−3/2 , −9/4) 2. y = 3x2 +x + 1 x = −1/6 (−1/6 , −11/12) 3. y = −x2 − 4 x = 0 (0 ,−4) 4. y = − 1/2 x2 + x + 5/2 x = 1 (1 , 3) 5. y = −x2 −6x −7 x = −3 (−3 , 2) 6. y = 2x2 + 12x + 9 x = −3 (−3 , −9)
Graphing Quadratic Functions
opens up, passes through (1, 4)
opens up, passes through (-1, 3)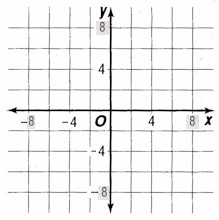
opens down, passes through (-2, 0)
opens down, passes through (-1, 1)
opens down, passes through (−2, 1)
opens up, passes through (-6, 9)