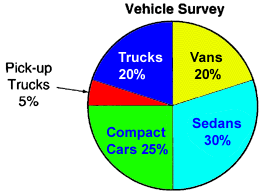
Modeling: Use the circle graph above. Find the number of compact cars that pass Jeff's
house. Use the graph above for Exercises 1 - 5. 1. Find the
number of sedans that pass Jeff's house. 5.
An automobile insurance company estimates that a total of 3,000 vehicles will pass by
Jeff's house next year. The percentages for each type of vehicle shown on the circle graph
is expected to remain the same. 2. Find the
number of vans that pass Jeff's house. 3. Find the
number of trucks that pass Jeff's house. 4. How many
more compact cars pass by Jeff's house than pick-up trucks? Copyright 1997-1999: html adaptation
Circle Graphs

Information can also be displayed using
a circle graph. A whole circle shows the entire amount or 100% of the given data. The
circle is divided into sections or sectors that show the fractional or percentage parts.

For a school project Jeff records the types of
vehicles that pass by his house during one day. From this information he makes the
following circle graph.
If 2,500 vehicles pass by Jeff's house, how many
are pick-up trucks?

From the graph you can see that 5% of the vehicles are pick-up trucks.
So find 5% of 2,500
0.05 x 2,500 =125

During the day 125 pick-up trucks pass Jeff's house.


Career Connection to Teaching with Technology