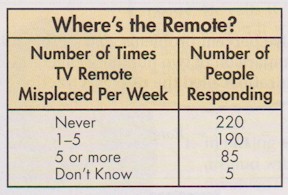

|
- Find the total number of people surveyed.
- Find the ratio that compares the number of people who responded in each category to the total number of people who responded to the survey.
- Since there are 360° in a circle, multiply each ratio by 360 to find the number of degrees for each section of your graph. Round to the nearest degree.
- Use a compass to draw a circle and a radius as shown at the left. Larger circles are easier to apportion.
- Use a protractor to draw angles. Start with the least number of degrees. Repeat for the remaining sections. Label each section and give the graph a title.
- What is the sum of the percents in your graph?
|
