These web-based activities were developed, during summer sessions from 1997 through 1999, by students at Mainland High School, located in Daytona Beach, FL. As part of Mainland's CCTT grant, the students were given permission by the book's publisher to convert the ancillary materials of the County's adopted Algebra 1 Textbook (Glencoe Algebra 1 - ISBN: 9780028253282) into html format.


story3.gif

Directions: Interpret each of the following graphs. Give your answer in complete sentences.


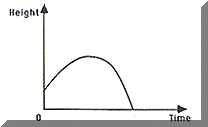
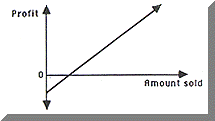
Cannonball shot from a cannon Lemonade stand
4aa.GIF 4ab.GIF
  1. When time is zero, why isn't the height also zero?

  2. In real-life situations, why are we often restricted to positive values?

  1. Why does the graph show values below zero?

  2. What is the meaning of the point where the graph crosses the horizontal axis?


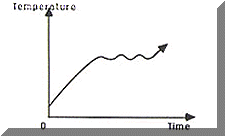
Roast in the Oven

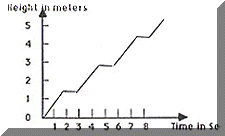
Flag

4ba.GIF 4bb.GIF
  1. Why is the roast's initial temperature close to 0°F?

  2. Why does the graph have a wavy appearance?

  1. What was happening to the flag?

  2. What was the height of the flagpole?

  3. Explain the shape of the curve.


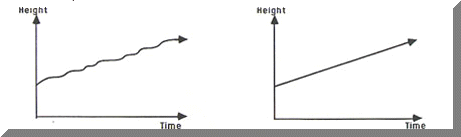
Tree Growth

Contrast the two graphs shown below. Which would be the graph for the growth of a tree over several years?
4c.GIF


Race

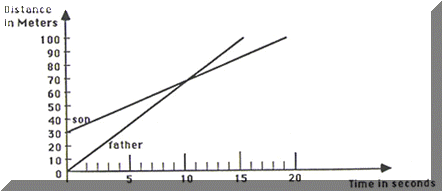
A boy challenges his father to a 100m race. The father allowed his son to start 30m ahead of him. Their highly simplified graphs are shown in the figure below.

5a.GIF

  1. Who won the race?

  2. How far from the start did the father overtake the son?

  3. How many seconds from the start were they side-by-side?


Sledding

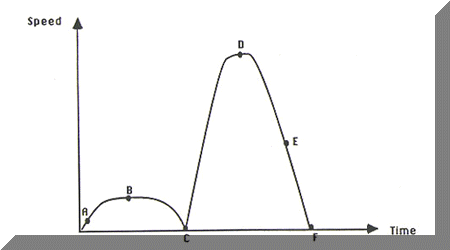
The event "climbing a hill and sledding down" is depicted in the graph shown below. Describe the sledder's journey at points A, B, C, D, E, and F.

5b.GIF


Copyright 1997-1999: html adaptation
Career Connection to Teaching with Technology