Practice: Section 6-3
Integration Statistics: Scatter Plots and Best-Fit Lines
Correlation Analysis
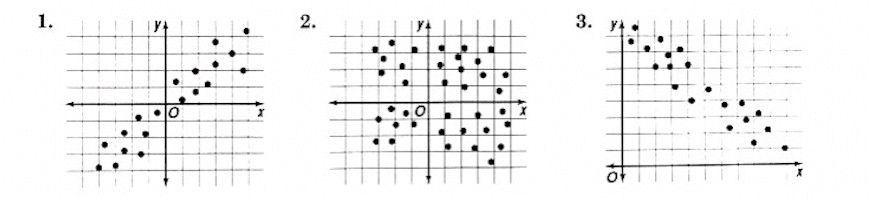
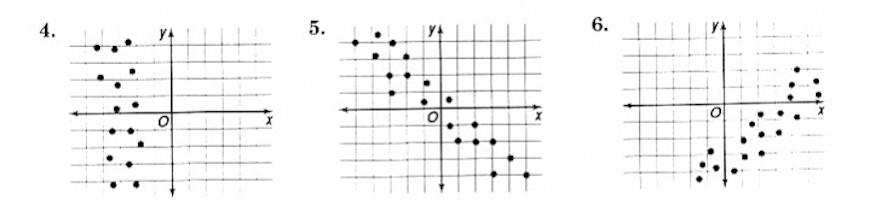
Directions: Which graphs show a correlation between the variables? If there is a correlation, is it positive, negative, or not possible to tell?
Problems 1–3
Problems 4–6
Test Score Analysis
The average California Achievement Test scores in mathematics and science for Wesley High School sophomores from 1985 to 1989 are given in the table below:
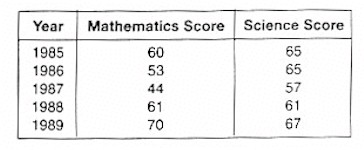
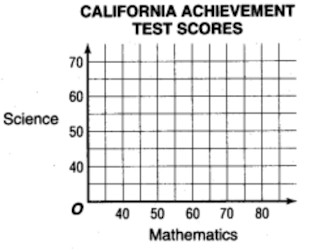
7. Make a scatter plot of the data using the coordinate plane provided above.
8. Does the scatter plot show a positive or negative correlation?
9. Predict the mathematics score corresponding to a science score of 50.
10. Predict the science score corresponding to a mathematics score of 65.