Practice: Section 1-4

Stem-and-Leaf Plots

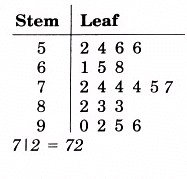
1. The stem-and-leaf plot at the right shows the scores for a 100-point unit exam in a science class.

  1. What were the highest and lowest scores on the test?
  2. Which test score occurred most frequently?
  3. In which 10-point interval did most of the students score?
  4. How many students received a score of 70 or better?
  5. How many students received a score less than 70?
Problem 1 Stem-and-Leaf Plot

2. Each number below represents the age of a worker at Fred's Fast Food.

205221394058274836205126
453049225950333528435520
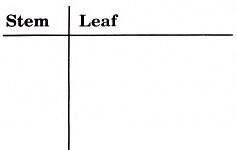
  1. Make a stem-and-leaf plot of the data. Use the space provided.
  2. How many people work at Fred's Fast Food?
  3. What is the difference in the ages between the oldest and youngest workers at Fred's?
  4. What is the most common age for a worker?
  5. Which age group is most widely represented?
  6. How many workers are older than 35 years?
Fred's Fast Food Stem-and-Leaf Plot Space

3. Each number below represents round lots of XXYZ stock traded each day over a 28-day period.

814722144413812118214533219254
183733624121325166722766814723
325445388239357746537155  
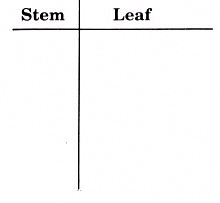
  1. Make a stem-and-leaf plot of the data in the space provided. Round numbers of shares to the nearest ten.
  2. How many times were more than 300 round lots of stock traded?
Stock Round Lots Stem-and-Leaf Plot Space