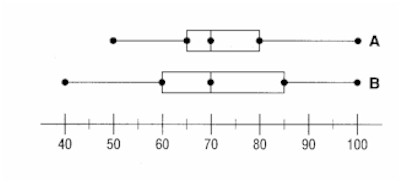
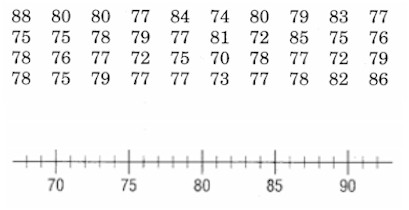
Practice Directions: Compare box-and-whisker plots A and B to answer each of the following questions. 1. What is the median of each set of data? 2. Which plot has the lesser range? 3. Which plot has the greater interquartile range? 4. What is the upper quartile of each set of data? 5. What is the lower quartile of each set of data? 6. What is the least value in plot A? 7. What is greatest value in plot B? 8. Which plot illustrates the lasger range of data? 9. What percent of the data in plot B id between 60 and 85? 10. What percent of the data in plot A is greater than 80? 11. What percent of the data on plot A is less than 65? 12. The numbers below represent forty eightteen-hole score of a golfer at Crystal Springs Golf Club. Make a box-and-whisker Plot of this data in the space provided. 13. What is the median score? 14. What percent of thee scores were higher than 75?
Box-and-Whisker Plots