
Page 2
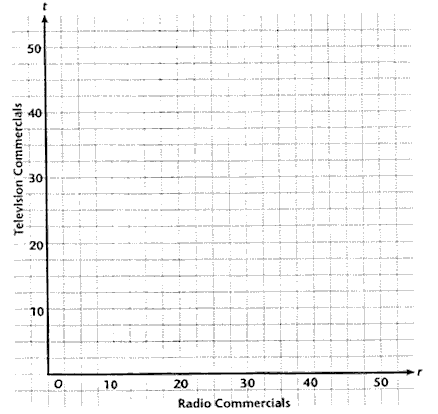
7. Copy each of your three constraints (from questions 4, 5, and 6) on the graph provided.
8. Shade the regions that represent the solution set. Then describe the shaded region.
_____________________________________________________________9. Find the coordinates of the vertices of the shaded region.
_____________________________________________________________10. Substitute the values for each vertex of the shaded region into the optimization equation to find the respective values for the optimization equation.
_____________________________________________________________
_____________________________________________________________
Page 1
Copyright 1997-1999: html adaptation
Career Connection to Teaching with Technology