|
|
|
These web-based activities were developed, during summer sessions from 1997 through 1999, by students at Mainland High School, located in Daytona Beach, FL. As part of Mainland's CCTT grant, the students were given permission by the book's publisher to convert the ancillary materials of the County's adopted Algebra 1 Textbook (Glencoe Algebra 1 - ISBN: 9780028253282) into html format.
|
|
|
 |
 |
 |
 Inflate one balloon until it feels tight, but not stretched.
(This seems so subjective but your goal is to inflate a balloon as large as
possible while still being able to cover it with a second balloon.)
Inflate one balloon until it feels tight, but not stretched.
(This seems so subjective but your goal is to inflate a balloon as large as
possible while still being able to cover it with a second balloon.)
 Tie a knot in the "neck" of a balloon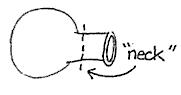
 Clip the "neck" of another balloon as shown.
 One student should then stretch the clipped balloon (Step #3) while the partner stuffs the
inflated balloon (Step #2) inside. Once this is done, the WORST is over. Clip a third balloon and use it to cover both nested balloons from Step #3.
One student should then stretch the clipped balloon (Step #3) while the partner stuffs the
inflated balloon (Step #2) inside. Once this is done, the WORST is over. Clip a third balloon and use it to cover both nested balloons from Step #3.
 Continue covering until all the balloons have been used. Number of balloons used to make your bouncing balloon ball:_________
 |
An oblong balloon can be "rounded" by positioning the open end of the clipped balloon in a different spot each time. |



 |
||
Drop Height |
Bounce Height |
ratio Y/X |
| ________ cm | ________ cm | ________ |
| ________ cm | ________ cm | ________ |
| ________ cm | ________ cm | ________ |
Average of this column |
________ | |
|
||
Drop Height |
Bounce Height |
ratio Y/X |
| ________ cm | ________ cm | ________ |
| ________ cm | ________ cm | ________ |
| ________ cm | ________ cm | ________ |
Average of this column |
________ | |
 …find the average of your two averages! ________
We will call this number the constant of your function.
…find the average of your two averages! ________
We will call this number the constant of your function.


Under the best of scientific testing conditions, the function of your Balloon Ball would have been a Linear Function, meaning that it’s graph would be on a line.
Let’s see how close you came to optimum conditions by graphing your X’s and Y’s from both trials…..
 …..how did you do?
Are your results an approximation of a line? What are some causal factors?
…..how did you do?
Are your results an approximation of a line? What are some causal factors?
|
|

 Let’s try! If the drop height were _______, what would
you predict the bounce height to be?
Let’s try! If the drop height were _______, what would
you predict the bounce height to be?
 Now, drop your balloon and record your experimental results. How do they compare with your prediction?
Explain any similarities or differences.
Now, drop your balloon and record your experimental results. How do they compare with your prediction?
Explain any similarities or differences.
Copyright 1997-1999: html adaptation
Career Connection to Teaching with Technology


 Once again, what was the constant of your function?
 What was the constant of your partner's function?
 How would you account for the difference in your constant and
your partner's constant? (Give at least two possible causes)
How would you account for the difference in your constant and
your partner's constant? (Give at least two possible causes) How could you use your constant to make predictions concerning your
bouncing balloon?
How could you use your constant to make predictions concerning your
bouncing balloon?