Constructing Parabolas
Materials
- heavy construction paper
- string
- tape
- scissors
- pencil
- ruler or straightedge
- looseleaf paper
You have seen how a given quadratic function has a parabolic graph. In this activity you will construct a parabola without being given an equation.
Copy the L-square into heavy construction paper and cut it out.
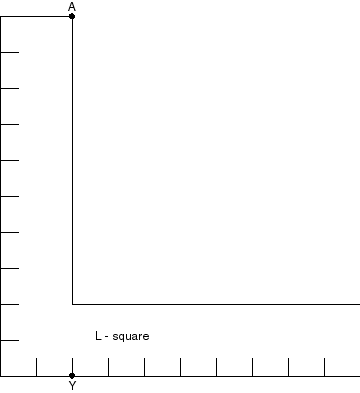
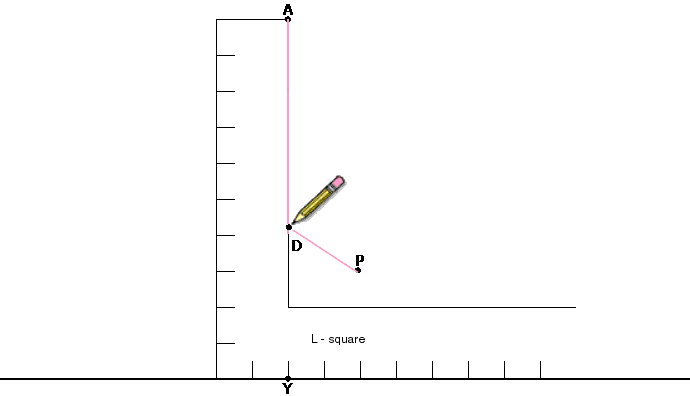
Next tape a piece of string at point A. Using the string, measure the distance AY. Cut the string at Y (pink line in diagram). Draw a straight line on a sheet of looseleaf paper. Place your L-square along the straight line. Choose point P and tape the free end of the string at point P. Place your pencil at point D along the L-square and use your pencil to hold the string tightly against the L-square.
1. What happens as you move the L-square to the left along the line?
2. Choose point P as a different location Repeat the process. Describe what happens to the curve as the location of point P changes.
You can also draw a parabola on "conic" graph paper, which is made by drawing a set of concentric circles on lined paper. Use this grid for exercises 3 and 4.
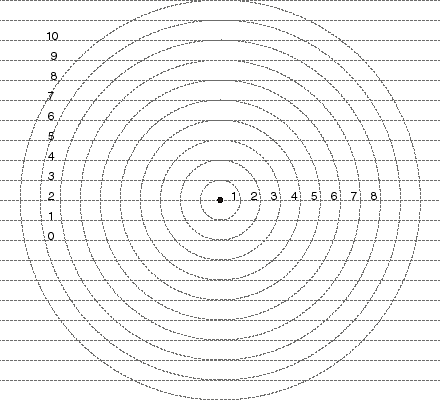
3. Mark the point where line 1 intersects circle 1. Next mark the two points where line 2 intersects circle 2 Then mark the points where line 3 intersects circle 3. Repeat the process for lines and circles 4 and 5. Connect the points with a smooth curve. Describe your graph.
4. On the same conic grid, mark the point where line 0 intersects circle 2. Next mark the two points where line 1 intersects circle 3. Then mark the two points where line 2 intersects circle 4. Repeat the process for lines 3 and 4. Connect the points with a smooth curve. Describe your graph.
A nomograph is a chart used to turn difficult calculations into simple ones. The graph of a quadratic function can be used to make a nomograph for finding one side of a right triangle when 2 are given. This nomograph is based on the "Pythagorean" Right-Triangle Theorem. It makes extensive use of squares and square roots.
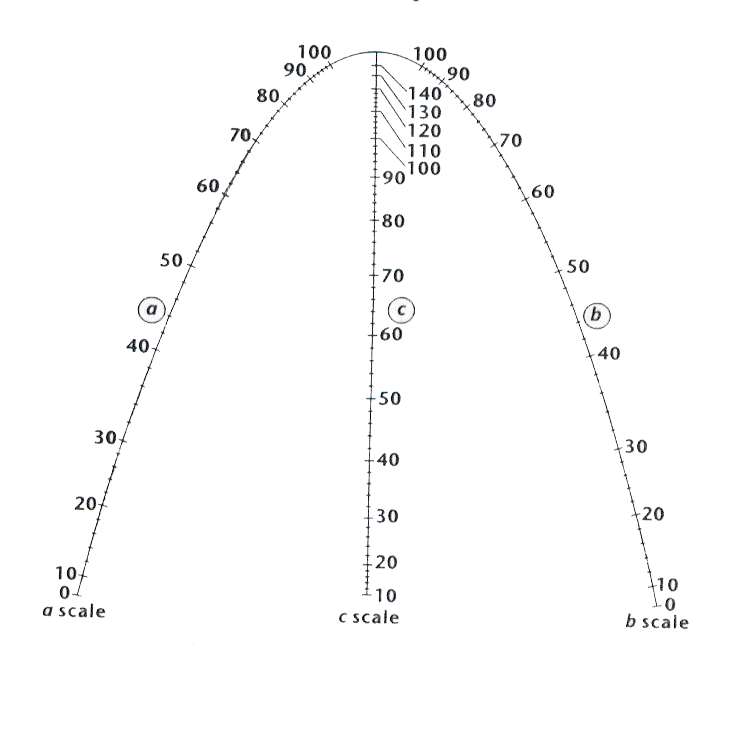
To find the hypotenuse of a right triange in which side a is 30 units and side b is 40 units, locate 30 on the a scale and lay a straightedge from 30 on the a scale to 40 on the b scale. The straight line crosses the (c) scale at 50. Thus the hyptenuse c of the right triangle with sides 30 and 40 is 50.
5. Use the nomograph to complete the table.
| a | b | c |
| 7 | 9 | |
| 24 | 21 | |
| 29 | 41 |
6. Describe the relationship you notice about a2 + b2 and c2. These combinations are known as Pythagorean Triplets.
Copyright 1997-1999: html adaptation
Career Connection to Teaching with Technology