Parent Functions and Family Groups
This material is discussed in your textbook in Sections 6-5A and 11-1B
See also: Linear Functions and Family Groups
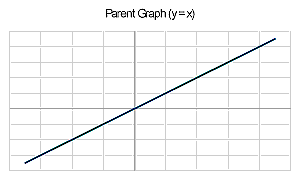
A parent graph is the basic representation of a function. For example, in Chapter 6, the parent function of the linear family is y = x where the slope equals 1 and the graph diagonally bisects the 1st and 3rd quadrants. All members of its family group conform to the equation y = ax + b where a≠0. In this family, a represents the slope of the line and b the y-axis intercept. To remain a function, the slope can be negative, positive, or zero; but remember that vertical lines, x = b, have undefined slope and are not functions. |
 |
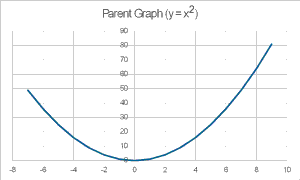
Introduced in Chapter 11, the parent function of the quadratic family (y = ax2 + bx + c) is y = x2. This parabola opens up and has its vertex located at (0,0).
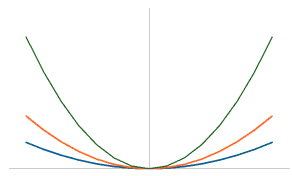
All positive values of a open up. As |a| increases "|a|>1" the parabola gets narrower. A value of a greater than 0 but less than 1 creates a wider parabola.
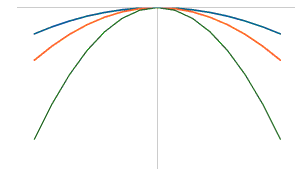
Negative values of a result in a parabola opening downward with the same pattern of changing width for a. Increasingly narrower when "|a|>1" and wider when |a| is greater than 0 but less than 1.
Different values of b and c can move the parabola's vertex and change its roots (positions where it crosses the x-axis.). That is a much more extensive conversation which will be saved for later. |
Practice your skills with these exercises on page 355: #1, 3, 4, 9 and these exercises on page 619: #1, 5, 6 |
Copyright 1997-1999: html adaptation
Career Connection to Teaching with Technology