
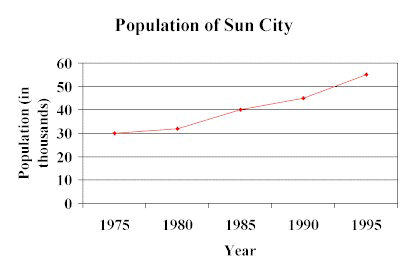
The line graph shows the population of Sun City over a 20-year period.
|
|||||||||||||||
 |
Using the graph above, determine how much the population of Sun City increased from 1980 to 1990? |
Solution: From the graph determine the populations for 1980 and 1990.
then subtract their values to find the answer.
Answer:The population of Sun City increased by 13,000 people.
NOTE: Read the question carefully, then read the graph carefully. Pay particular attention to the scale.
TRY THIS ONE


Use the graph above. During which 5-year period was the increase in the population the greatest?
PRACTICE
Use the graph above for Exercises 1-4
1. During which 5-year period was the increase in the population the least? 3. How much did the population of Sun City increase from 1985 to 1995 2. How much did the population of Sun City increase from 1975 to 1985? 4. How much did the population of Sun City increase from 1975 to 1995
Copyright 1997-1999: html adaptation
Career Connection to Teaching with Technology