
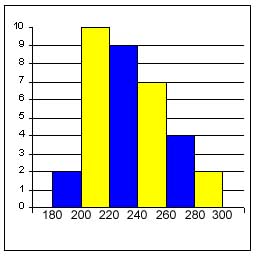
A histogram is a type of bar graph that displays the frequencies in a distribution of data that has been divided into equal intervals. Notice that there is no space between bars. (A boundary grade, like 200 or 240, is included in the lower interval. For example: 200 would be included in the 180-200 interval.)
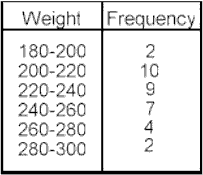
Example: Weight of the players on the Mather Jr. High's football team
1. Give the histogram a name. 2. What does the vertical scale represent?
3. What does the horizontal scale represent?
4. How many weight between 220 and 240?
5. How many players are there on the team?
6. How many weigh over 240 pounds?
7. How many weigh 227 pounds?
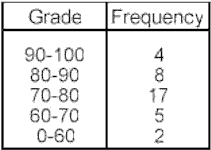
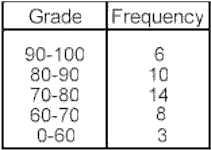
Make a histogram using the given data.
8. Grades in Mr. Miner's Math Class
9. Grades in Mrs. Colburn's Math class.
Copyright 1997-1999: html adaptation
Career Connection to Teaching with Technology