A. Use the information in the bar graph on previous page to complete each item.
1. The largest number of household belongs to what income level? 2. What percent of the households surveyed reported annual income of over $50,000? 3. The table shows the percent of households that report annual income for each category on a national level. Complete the table with the appropriate percentages for Cooke County
National
Cooke County
Under $10,000
15% . $10,000 - 24,999 27% . $25,000 - 49,000 33% . $50,000 - 74,000 23% . Over $75,000 10% .
4.
How would you describe the income levels in Cooke County as compared to the national income levels?
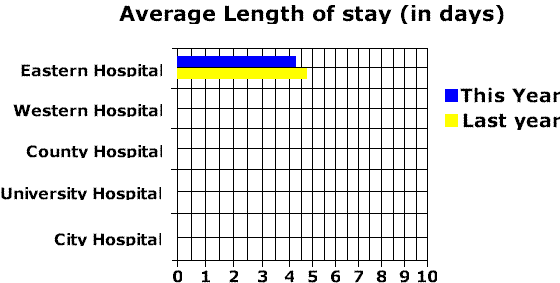
B. Construct a horizontal bar graph using the following information. Plot the bars for last year and this year adjacent to one another. Use the data plotted for Eastern Hospital as a guide line. A researcher investigated five hospitals to find the average length of a stay last year and this year. Here are the figures:
Last year
This year Eastern Hospital 5.3 4.8 Western Hospital 8.1 7.3 County Hospital 5.0 4.2 University Hospital 8.2 6.7 City Hospital 5.9 5.1
Copyright 1997-1999: html adaptation
Career Connection to Teaching with Technology