
The process of representing real-world situations mathematically is known as mathematical modeling. We will try to find a mathematical model for the total number of toothpicks required to construct a square of any size that is subdivided into 1 x 1 squares of toothpicks. A 1 x 1 square and a 2 x 2 square are shown below.

1. a. How many toothpicks does the 1 x 1 square
require?
b. The 2 x 2 square?
2. Make a 3 x 3 square and count the toothpicks. How many are there?
3. A useful piece of information is the number that corresponds to the case of 0. How many toothpicks are required for a 0 x 0 square?
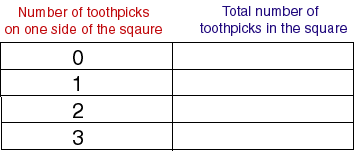
4. Complete this table:

To find a formula for the total number of toothpicks in any size square additional data is needed. On the next problems you will extend your table by analyzing the way the total number of toothpicks changes.
| 5. A good way to count the toothpicks for a given square is to
count only the new ones added to the previous square, then add these to the previous
square's total. The figure to the right shows how to do this for the 3 x 3 square. The single tick marks represent the toothpicks counted first, the double tick marks those counted second, the triple tick marks counted third, and the quadruple tick marks those counted fourth. Note that there are three toothpicks in every set and that there are four sets. This means that the 3 x 3 square requires twelve more toothpicks than the 2 x 2 square. Now try adding toothpicks in the same way to the 3 x 3 square to obtain a 4 x 4 square.
|
|
|
 |
7. Use your formula for the number of new toothpicks in part 6 to predict the number of new toothpicks needed to build a 4 x 4 square into a 5 x 5 square.
8. How many new toothpicks does your formula predict are necessary to go from a 0 x 0 square to a 1 x 1 square? Does your table confirm this?
9. Mathematical models often can be extended beyond what is reasonable in a given problem situation. Consider the case k = -1.
Extend your table to permit negative numbers. How many new toothpicks does your formula predict would be necessary to go from a (-1) x (-1) square to a 0 x 0 square? Use this to find a number to place opposite -1 in your table.
10. Repeat what you did in part 9 for k = -2.
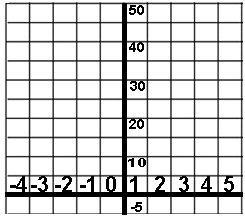
| 11. As a first step in finding a formula for the total number of toothpicks, graph all the pairs in your table on the coordinate axes at the right. |  |
12. Does the graph have the shape of a parabola? Compare it to the graph of f(x) = x2 by estimating each of the following:

Helpful Hint: because a parabola has a vertical line of symmetry, you can estimate the horizontal shift by locating a point halfway between the places the graph crosses the x-axis, also called the zeros of the function.
13. Write the equation of the parabola given by your answers to part 12.
14. Use your calculator to test your equation. Substitute each value from the first column of the table below and record the predicted number of toothpicks. Also record the amount, if any, by which your prediction misses the actual number.

15. If your function does not predict the actual number of toothpicks, adjusting the vertical shift will remedy this. Adjust your function and repeat the calculations.
| MathSummer
Projects Copyright 1997-1999 Career Connection to Teaching with Technology All rights reserved unless otherwise specified |