This activity was developed by a student or students at Mainland High School which is located in Daytona Beach, FL. It is still a "work in progress" with editing and improvements yet to come.
Stem-and-Leaf Plots
Their Construction and Use
One way to make data more usable is to make a stem-and-leaf plot. The digit(s) in the greatest place value(s) of the data values are the stems. The digits in the next greatest place values are the leaves. For example, if all the data are two-digit numbers, the number in the tens place would be used for the stem. The number in the ones place would be used for the leaf.
Group Project
1. Example 1 Refer to the World Population Data Sheet in your Reference Section. Find the Per Capita GNP (US $) for each country. This refers to the annual income per person in U.S. dollars. A stem-and-leaf plot of the income data for the countries in Western Africa is shown below. Can you see how this graph was constructed?

To construct a stem-and-leaf plot, follow the steps below.
|
2. In your group, analyze the stem-and-leaf plot for the countries in Western Africa shown above. What conclusions can you reach about the incomes for the countries of Western Africa?
3. Investigate the data for each of the other four regions of Africa.
a. Make a stem-and-leaf plot for each Africa
region.
b. For each plot, find the data and make one stem-and-leaf plot for all
of the countries of Africa.
c. Combine the data and make one stem-and-leaf plot for all of the
countries of Africa.
d. Find the mean, median, mode, and range and mark these on the
national stem-and-leaf plot.
4. COMPUTER ACTIVITY Study your computer software for spreadsheets or a data base to see what kind of graphs can be made. Compare the computer graphs to stem-and-leaf plots of the data in Exercise 1. Discuss any similarities or differences.
Example 2: Sometimes when data are closely grouped, using numbers on the stem that are closer together, or smaller intervals, can make the data easier to analyze.
Study the data for Infant Mortality Rates, the number of infant deaths per 1,000 live births, of countries in Western Africa. Use the World Population Data Sheet in your Reference Section. You will notice that most of these values are in the interval 100 to 175. A stem-and-leaf plot for this data is shown below.

5. In your group, analyze the stem-and-leaf plot for Western Africa shown above.
a. Find the mean,
median, mode, and range. Mark these values on the plot.
b. What conclusions can you reach about the death
rates of infants for the countries of Western Africa?
c. What might you predict about the rest of Africa
from this data?
6. Investigate the infant mortality data for each of the other four regions of Africa.
a. Make a
stem-and-leaf plot of the infant mortality data for the other African regions.
b. For each plot, find the mean, median, mode, and
range. Mark these values on the plot.
c. Combine the data and make one stem-and-leaf plot
for all of the countries of Africa.
d. Find the mean, median, mode, and range. Mark these
on the national stem-and-leaf plot.
Homework Project
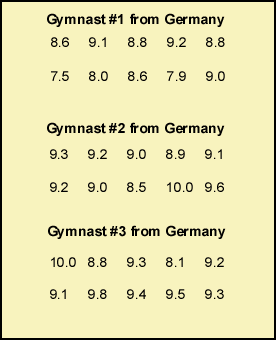
7. For some sports in the Olympics, such as diving and gymnastics, the highest and lowest scores given by a judge are dropped. Study the scores given by ten judges for three gymnasts listed.


a. Make a line plot of the scores for
each gymnast.
b. Find the mode, median, mean, and range for each set of 10 scores.
Then, find the mode, median, mean, and range after dropping the highest and lowest scores
for each athlete.
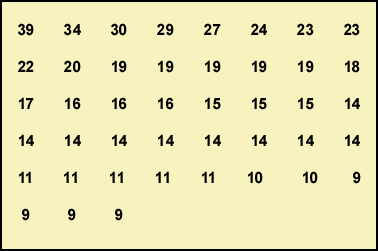
8. The numbers below represent the weights in pounds of fish caught by contestants in a Striped Bass Derby.

a. Use the data to make a
stem-and-leaf plot.
b. Obtain data from some contest in your area. Make a stem-and-leaf plot.
Write a brief analysis of the data to report to the class.
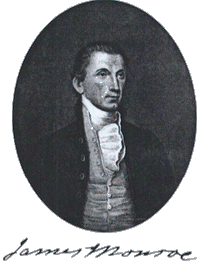
9. Refer to the table labeled "Inaugurations and Deaths of U.S. Presidents," in your Reference Section. a. Make a stem-and-leaf plot
of the ages at inauguration, and another for ages at death. Which varies more? |
 |
| MathSummer Activity
Summary Copyright 1997-1999: html adaptation Career Connection to Teaching with Technology |