
|
This activity was developed by a student or students at Mainland High School which is located in Daytona Beach, FL. It is still a "work in progress" with editing and improvements yet to come. |
|
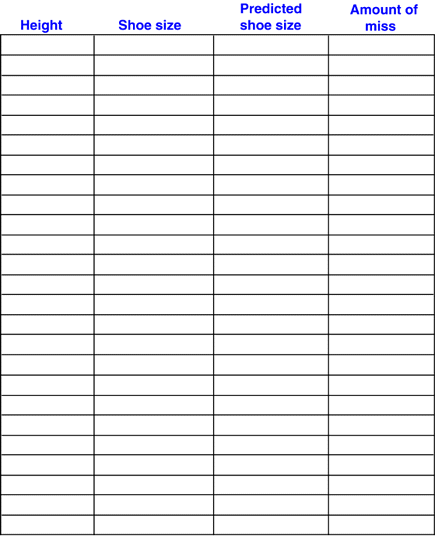
1. Record your shoe size and height in inches. Since sizing is different for men and women, female students will need to record the corresponding men's size if they know it or subtract 1.5 from their women's size. Record the results from the class in the table at the bottom. |
 |
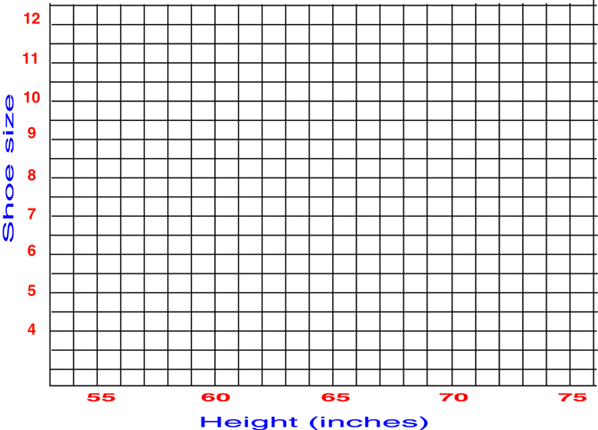
2. Now for each person, plot the pair (height and shoe size) as a point on the grid.
| 3.
Do most of the points seem to come close to falling on a line? One way to tell is to draw
a small circle around the point. The smaller the circle, the closer the points are to
lining up. The larger the circle the less they fall in a straight line.
4. Draw a line through the middle of your scatter plot. The line should also run through the center of your circle.
5. Your line is a geometric model for the relationship between height and shoe size.
You can use your model to estimate your shoe size. Find your height on the horizontal scale and move upward until you come to the line. Then move to the left until you come to the vertical scale. Read your predicted shoe size. What shoe size was predicted?____________ How does the predicted shoe size compare with your actual shoe size?_______________________
6. Choose two points on your line whose coordinates are integers. They do not have to be points of your original data but should be fairly far apart. Record the coordinates of the points below:
_____________ ____________
7. Use the two points to find the slope of the line. ___________________
8. Use the slope and one of your two points to find the y-intercept (0, b) of the line. Write the y-intercept and the equation of the line below: y-intercept: ___________________
equation: ____________________ 9. Your equation is an algebraic model for the relationship between height and shoe size. Use this model to calculate your predicted shoe size. Do this by substituting your height for x in the equation and rounding the shoe size to the nearest 0.5. What shoe size was predicted? _____________ How close is the predicted size to your real shoe size? _________________________
10. Use your equation to calculate the predicted shoe size for each member of your class. Be sure to round to the nearest 0.5. Record the results in the third column of the table. In the fourth column, record the amount the predicted size missed the real size for each student.
11.Compare you misses with those of another student. Whose line did the best job of predicting shoe sizes for members of your class? Why?
12. a. According to the Guinness Book of World Records, the tallest person who ever lived was Robert Wadlow, who was 8 ft, 11 inches tall. What shoe size would you predict for him?__________
b. The tallest living women is Sandy Allen at 7 feet, 7 inches. What shoe size does your equation predict for her?___________
13. What shoe size does your equation predict for a person who is 50 inches tall?_____________
14. Do you think this prediction is reasonable? Explain. |
|
|---|---|
|
![]()
![]()
![]()
![]()