
| Project Goal: Collect and graph data
about something that changes over time. You will look for patterns in your graph. |
COLLECTING DATA
Work with a partner. Choose an event that occurs in the world around you. Whatever you choose should be easy to measure and should change noticeably within minutes, hours or days.
Some possibilities
- the height of a moving pedal on a moving bicycle
- the temperature of each hour of the day.
- the number of cars in a fast food parking lot at different times of the day.
- The number of people going into a mall on different days or at different hours.
Investigate and record what you observe. For example, suppose you decide to investigate how the height of a bicycle pedal changes over time.
1. MEASURE the height of a pedal in different positions
2. RECORD when the pedal is in each
position. Making a video can help you see a change that happens quickly.
3. ORGANIZE your data in a data table or spreadsheet
MAKING A GRAPH
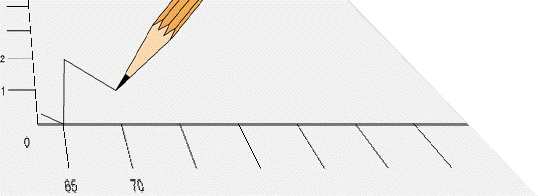
Use your data to make a graph of the function. Do you see a pattern? What do you think happens between the points that you plot? Does it make sense to connect the points?

PRESENTING YOUR IDEAS
Write a report, make a poster, or give an oral presentation explaining your graph. Describe what you observed and discuss any patterns you see. Describe the domain range of your function. You may also want to look through books, magazines, and other sources at the library. Can you find data about the functions like the one you investigated? How does the data compare with yours? Before giving your presentation, you may want to show your classmates your graph without the title or the labels to see if they can guess what you observed.
Self-Assessment
Describe what you and your partner learned about collecting and graphing data. For example, how did you decide what to investigate? How did you decide on values to use for the axis of your graph? Did you discuss ideas together? Did you divide up some of the work? What might you do differently next time?
| MathSummer
Projects Copyright 1997-1999 Career Connection to Teaching with Technology All rights reserved unless otherwise specified |