
This activity was developed by a student or students at Mainland High School which is located in Daytona Beach, FL. It is still a "work in progress" with editing and improvements yet to come.
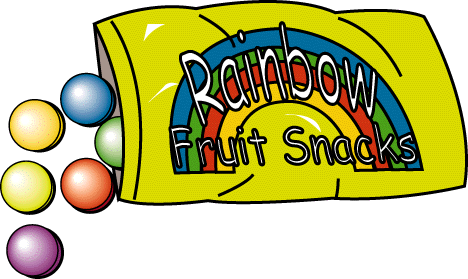
Hector is a high school student taking algebra. He loves Rainbow Fruit Snacks and buys a package almost everyday. He has noticed that sometimes it seems like there are fewer snacks in a package than other times. He has also noticed that the number of fruit snacks of each color is not always the same. His algebra teacher has assigned a project in which each student must do a statistical study of something in his or her everyday life. Hector has decided to study the statistics of Rainbow Fruit Snacks.
In this project, you will use your knowledge of statistics to help Hector analyze samples of fruit snacks. Hector bought 20 packages of fruit snacks and counted the number of fruit snacks in each package. The table shows data that Hector collected.
Package |
# of fruit snacks |
Package # |
# of fruit snacks |
1 |
20 |
11 |
26 |
2 |
22 |
12 |
21 |
3 |
19 |
13 |
21 |
4 |
20 |
14 |
23 |
5 |
26 |
15 |
24 |
6 |
18 |
16 |
19 |
7 |
19 |
17 |
23 |
8 |
21 |
18 |
22 |
9 |
23 |
19 |
26 |
10 |
25 |
20 |
22 |
1. What is the mean number of fruit snacks in a package based on the 20 packages that Hector bought?
2. Explain the process you used to find the mean.
3. What is the median number of fruit snacks in a package based on the 20 packages that Hector bought?
4. Explain the process you used to find them.
5. Find the mode(s) for Hector's data.
6. Explain the process you used to find the mode(s).
7. What is the range of the number of fruit snacks in the 20 packages?
8. Explain the process you used to find the range.
9. Use the grid below and the data from Hector's table to create a histogram. Use intervals of 2 for the number of fruit snacks per package.
| Number of Pakages |
|||||||||||||||||||||||||||||||||||||||||||||||||||||||||||||||||||||||||||||||||||||||||||||||||||||||||||||||||||||||||||||||||||||||||||||||||||||||||||||||||||||||||||||||||||||||||||||||||||||||||||||||||||||||||||||||||||||||||||||||||||||||||||||||||||||||||||||||||||||||||||||||||||||||||||||||||||||||||||||||||||||||||||||||||
Number of fruit snacks per package |
10. Find the upper and lower quartiles for the data from Hector's table.
11. Use the data from Hector's table to create a box-and-whisker plot in the space provided.
Hector also collected data about the colors of the fruit snacks in the packages. He counted the number of each color for each of the 20 packages and recorded the data in a table.
COLORS
| Package # | Purple | Green | Yellow | Blue | Red | Orange |
| 1 | 3 | 2 | 4 | 7 | 3 | 1 |
| 2 | 4 | 2 | 4 | 7 | 3 | 2 |
| 3 | 3 | 1 | 4 | 7 | 3 | 1 |
| 4 | 2 | 3 | 4 | 6 | 3 | 2 |
| 5 | 4 | 3 | 5 | 7 | 5 | 2 |
| 6 | 3 | 2 | 2 | 7 | 3 | 1 |
| 7 | 3 | 3 | 3 | 6 | 2 | 2 |
| 8 | 1 | 5 | 7 | 4 | 1 | 3 |
| 9 | 2 | 4 | 1 | 5 | 7 | 4 |
| 10 | 5 | 5 | 2 | 5 | 5 | 3 |
| 11 | 4 | 3 | 3 | 8 | 4 | 4 |
| 12 | 2 | 4 | 7 | 4 | 2 | 2 |
| 13 | 3 | 4 | 6 | 3 | 3 | 2 |
| 14 | 4 | 4 | 6 | 4 | 3 | 2 |
| 15 | 4 | 4 | 5 | 6 | 2 | 3 |
| 16 | 3 | 1 | 4 | 7 | 3 | 1 |
| 17 | 2 | 4 | 1 | 6 | 6 | 4 |
| 18 | 4 | 2 | 4 | 6 | 3 | 3 |
| 19 | 4 | 4 | 4 | 6 | 6 | 2 |
| 20 | 5 | 1 | 4 | 5 | 3 | 4 |
Calculate the mean for each color. Round your result to the nearest whole number.
12. purple _______________ 13. green _______________ 14. yellow _______________
15. blue _______________ 16. red _______________ 17. orange _______________
18. Using the means you calculated, how many total fruit snacks would be in a package consisting of the mean number of each color?
Using this number of total fruit snacks and the mean number of each color, determine the percent of the total package for each of the color. Round your results to the nearest percent.
19. purple _______________ 20. green _______________ 21. yellow _______________
22. blue _______________ 23. red _______________ 24. orange _______________
25. Use your calculations to construct a circle graph to represent the package containing the mean number of each color. Be sure to label the sections of circle graph to represent the package containing the mean number of each color Be sure to label the sections of your circle graph with the appropriate color.
Assuming that the same percent would be represented in a larger package of fruit snacks, how many fruit snacks of each color would there be in a package of 300 fruit snacks.
26. purple _______________ 27. green _______________ 28. yellow _______________
29. blue _______________ 30. red _______________ 31. orange _______________
32. Based on the data in Hector's table, which color or colors have the greatest range?
33. What is the mode of the yellow fruit snacks?
34. What is the median of the blue fruit snacks?
35. Choose a situation of your own for which you conduct a similar statistical analysis. Describe your situation in the space provided. Be sure to include a description of what statistical calculations and graphs would be useful.
| MathSummer Activity
Summary Copyright 1997-1999: html adaptation Career Connection to Teaching with Technology |